The Health Workforce Simulation Model (HWSM) is an integrated microsimulation model that estimates the current and future supply of and demand for health care workers by occupation, geographic location, and year. This report documents the methods, data, and assumptions for projecting workforce supply and demand, as well as data and model limitations. Each year, this report is updated to reflect new data sources and refinements to HWSM. Workforce projections are available on the Bureau of Health Workforce page, Projecting Health Workforce Supply and Demand.
Projections of workforce supply and demand inform programs and policies to improve the overall supply adequacy of health care workers at the national, state, and local levels. Such projections also help inform the career decisions of individuals interested in health care opportunities. An adequate supply of health care workers is required to achieve national goals of improving access to quality health services, fostering a health care workforce able to address current and emerging needs, achieving health equity, and enhancing population health.1 The projections promote efficient allocation of resources for training of health care workers and informing jobseekers about a particular health occupation or specialty. Training more health care workers than required (i.e., excess capacity) can have detrimental consequences for providers seeking fulfillment in their career in addition to the inefficient use of the country’s resources. Training too few health care workers (i.e., shortage) reduces access to care, especially for historically underserved and vulnerable populations. Shortages in the health workforce also increase the cost of care and contribute to burnout among existing health care workers. HWSM is designed to produce forecasts of supply adequacy under different scenarios, including those around improved access to care.
The projections developed in FY 2023 used 2021 as the starting year for the projections. Projections developed in earlier years usually had a two-year lag between projections development and the starting year for modeling. This lag reflects the availability of key data used in modeling. Some data used in the projections predate the COVID-19 pandemic, which caused substantial disruption to the health care delivery system starting in 2020. Other data sources for 2020 and beyond occurred during the beginning of the pandemic and/or before vaccination became available.
Population projections are a key component of modeling demand. The starting point for demand projections is July 2021 Census Bureau county population estimates. The Centers for Disease Control and Prevention report that through June 30, 2021, an estimated 664,000 excess deaths occurred due to the COVID-19 pandemic. These deaths are accounted for in the population projections. From July 1, 2021, through March 31, 2023, an estimated 663,000 excess deaths occurred.2 States that produced population projections used different approaches and assumptions to develop their projections, and for states that produced projections after July 1, 2021, it is unclear how much of the recent excess deaths is captured in the projections.
There are still many unknowns about the long-term care needs for people with lingering symptoms from COVID-19, and the implications of delays in receiving preventive care during the pandemic. The updated projections model assumptions around COVID-19 becoming endemic. These include assumptions of future incidence of COVID-19, the percentage of new cases that require outpatient care or hospitalization, and the prevalence of long COVID and health care use patterns of people seeking treatment for long COVID.
Numerous studies find that the pandemic exacerbated the already high levels of burnout among health care workers.3 4 5 6 7 Hours worked and retirement patterns for health care workers are largely based on 2021 – 2022 data. Given the many uncertainties, HRSA is committed to updating workforce projections as new information becomes available on the potential long-term workforce implications of COVID-19 or other trends affecting supply or demand.
For modeling, we measure both supply and demand in terms of full-time equivalents (FTEs). Unless otherwise specified, throughout this report demand is used synonymously with “FTE demand” and supply is used synonymously with “FTE supply”. One FTE is defined as 40 hours per week in professional activities, which include patient and non-patient care activities but excludes on-call hours when not providing care.8
Workforce demand is defined as the number of health care workers required to provide a level of services that will be utilized given patient health-seeking behavior, and ability and willingness to pay for health care services. As discussed later, demand is different from need. Demand reflects the level of care that people are likely to use, while need is usually a clinical definition.
Supply in the starting year is defined as the number of FTE health care workers active in the workforce. For occupations that require licensure or certification, the number of people trained and eligible to work often will exceed actual supply. Some licensed professionals might be temporarily out of the workforce; others might have retired although their license remains active, and others might be seeking employment but unable to find work. For some occupations, the net growth in supply from one year to the next might exceed the available jobs. When projections of future supply exceed demand, the supply projections reflect a combination of people in the workforce plus people trained who cannot find employment in the profession.
HWSM produces national and state-level workforce projections. Starting in FY 2019, HWSM models demand at the county level so that projections can be aggregated by metropolitan/nonmetropolitan designation for reporting. Supply is available by metropolitan/ nonmetropolitan designation for some health occupations.
While the nuances of modeling differ for individual health occupations and medical specialties, the basic framework used within HWSM remains the same and consists of two major components ( Exhibit I‑1):
- Supply modeling, which starts with the current supply and projects the future supply of health care workers
- Demand modeling, which estimates the current and future demand for health care services and the health care workers required to meet the demand for services
An overview of the supply and demand components of HWSM is provided in the next two modules. HWSM is a microsimulation model, meaning that supply is modeled by simulating career decisions of individual health care workers among a representative sample or population of health care workers. Demand is modeled by simulating health care use patterns for each person in a representative sample of the population. Both supply and demand modeling use local (state or county) data where such information is available and national data when local sources are unavailable.
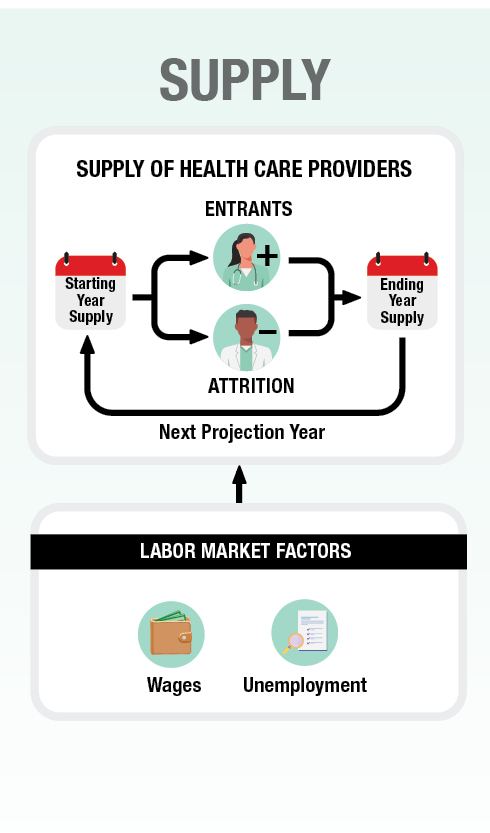
Exhibit I-1: HRSA’s Health Workforce Simulation Model
This diagram shows how various inputs are synthesized into projections of supply and demand. It gives a high-level view of the model. The individual components are explained in more detail in this module.
For supply, the model uses the starting year number of people active in the workforce. It then adds new entrants, like recent graduates and professionals moving into the field, and subtracts those exiting, like retirees and professionals moving out of the field. The result is the number of full-time equivalent workers at the end of that year. This value becomes the starting value for the next year, and the process continues until it reaches the final year of the model.
Labor market factors like wages and unemployment will impact new entrants and attrition. For example, workers may opt to exit the field if wages in other fields increase and make working in those fields more attractive.
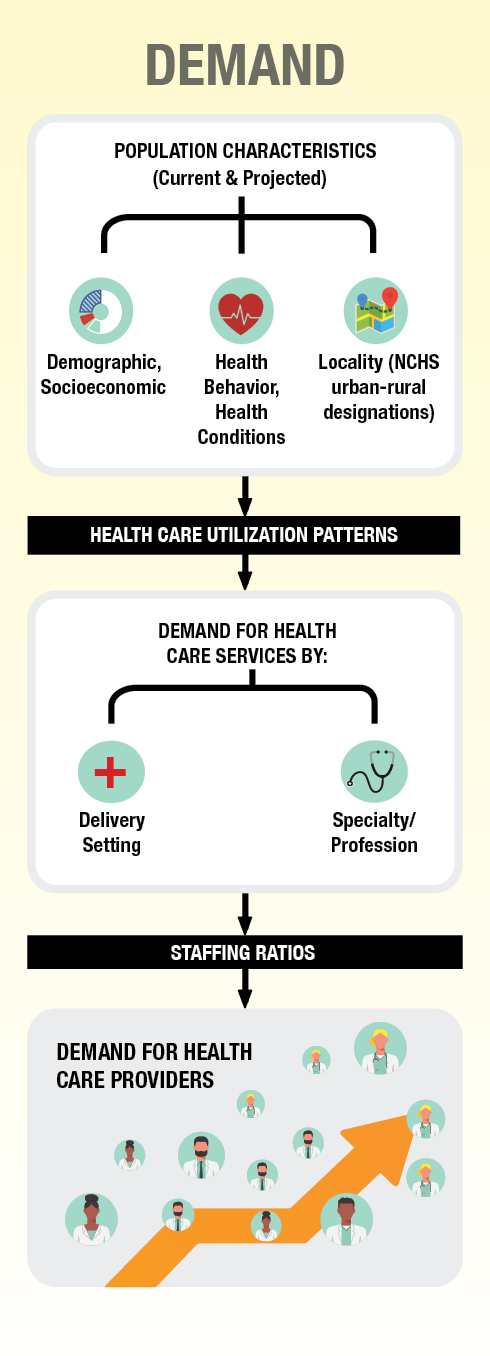
For demand, we examine the population characteristics of the United States. These include the demographic and socioeconomic characteristics of the current and future population as well as where they live. The model also uses data on the health conditions and health behavior of the population. These data are used to construct health care utilization patterns, which are then used to project the demand for specific health care services by provider type and setting.
The final demand step is to convert the demand for specific services into a demand for health care workers by using staffing ratios. For example, a projected number of x teeth cleanings demanded by the population would necessitate y number of dental hygienists to perform.
HWSM models future supply and demand under different scenarios reflecting trends and assumptions about key supply and demand determinants. All scenarios reflect changing demographics. For example, supply accounts for the aging of the health workforce and differences between men and women in labor force participation. Demand accounts for population growth and aging. Additional supply scenarios model the sensitivity of projections to uncertainty, such as whether health care workers might retire earlier or delay retirement relative to historical patterns. Likewise, other scenarios model the implications of training more or fewer health care workers compared to current levels. An additional scenario estimates how patient health care use might change if barriers to accessing care were removed and the implications for health care workforce demand.
HWSM runs using R software. The model consists of self-contained modules, which describe different components of the health care system consistent with best practices for modeling complex systems.9 HWSM continues to be maintained and refined with new occupations added periodically and scenario modeling capabilities enhanced. Each year, the model is used to project supply and demand for selected occupations and updated with the most recent data from key sources. Substantial efforts continue to make HWSM transparent and peer-reviewed, with feedback used to refine HWSM inputs and assumptions.
The remainder of this report documents the logic, methods, data, assumptions, and validation processes for HWSM in general, and how the model adapts to individual health occupations. The Supply Modeling Overview and the Demand Modeling Overview modules provide an overview of the supply and demand components of HWSM, respectively.
The HWSM Validation, Strengths and Limitations, and Improvement module describes model strengths, limitations, validation activities, and possible areas for improvement. Other reports and fact sheets published by HRSA summarize model supply and demand projections by occupation.10 The remaining modules provide information on specific health occupation categories and how HWSM adapts to each occupation or specialty area.
Date Last Reviewed: